


A greater focus on business impact is needed when calculating country risk

Global companies are increasingly investing in developing economies. However, these markets bring new political and economic challenges that can have a big impact on profitability.
An appraisal of political and economic realities usually includes financial evaluations. However, typical methods used – which employ data on credit default swaps (CDS), sovereign bond spreads, or sovereign ratings – consider the risk of default on the obligations undertaken by the state. They do not refer directly to risks associated with doing business in a country as a private company.
Quantifying qualitative factors
A nuanced understanding of the impact of country risk on the Expected Net Present Value (NPV) helps companies make better investment decisions and enables more effective risk mitigation strategies. Structured identification of relevant risk indicators, the collection of intelligence and data using local sources, and input by country, political and economic experts, all drive the unique risk profile.
Using this underlying data and expertise generates the likelihood of specific ‘risk events’ being triggered in a country and enables a company to calculate a Country Risk Premium (CRP) that unveils impact on the Internal Rate of Return (IRR) and NPV for a particular project. ‘Risk events’ are defined with business impact in mind, for example, the likelihood of: a higher tax rate on corporate profits; a spike in energy costs; or possible labour strikes. These specific parameters allow a company to assess the cash flow implications in a meaningful, quantitative way.
Unique risk evaluations
The analysis we have done shows the value of the CRP calculated from the expected losses in future cash flow is sensitive to four principal factors: a) economic sector; b) project type; c) the composition of the cash flows; and d) original rate of return on the investment. These four factors show that a ‘one-size-fits-all’ CRP could lead to value-destroying decisions.
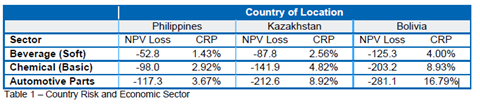
If we first break down economic sector, we can start to see the variety within countries. Table 1’s results are from a study we recently completed on how these economic risks can affect a company’s balance sheet. Results show a wide variation by sector in the impact of country risk for greenfield investments, demonstrating that the application of the same CRP to all investments in a country can lead to serious errors in asset valuations. For example, the risk level for the auto parts sector is consistently higher than others, driven by its use of domestic resources such as labour.
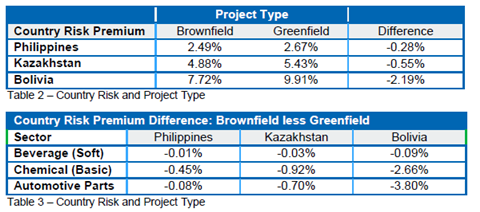
For the second factor, project type, analysis shows that investments in acquiring existing assets (brownfield projects) will have lower CRPs than greenfield projects (Table 2). The premium for brownfield projects is always lower because the risks associated with the development phase of a project do not apply to the purchase of an operating asset. Moreover, the variation between brownfield and greenfield projects is also sensitive to the economic sector where the investment is made (Table 3). In the Philippines and Kazakhstan, the difference is relatively high for the chemical sector because it is capital intensive, so development costs and thus, associated risks, have a greater weight and push up the risk premium compared to an investment made in acquiring assets already in operation.
Within one country, the probabilities of different risk events occurring will not be the same – risk of tax rises might be low but the risk of violence high. Since risk events have an impact on different components of cash flow the calculations of expected cash flow losses and CRP will be affected by the composition of the cash flows, the third factor in the method, that are forecast for an investment.
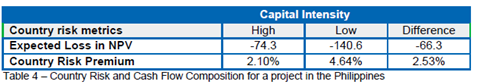
In order to analyse the effect on CRP, we have constructed cash flow forecasts for two greenfield investment projects in the same sector in the Philippines that are also assumed to be exposed to the same country risk events. The original NPV/IRR of the two projects is identical, but in one capital expenditure is relatively high and operating costs low compared to the other.
The results in Table 4 show that the ‘high capital intensity’ project has a lower exposure to country risk over its lifetime, as measured by the CRP. In this case, its operating costs have a relatively lower weight in overall cash flows, so over the production phase of the investment (assumed to last 20 years) it is much less exposed than the ‘low capital intensity’ project to risks of increases in local wage and energy costs. This result is sensitive, however, to the assessment of the probabilities of individual events occurring in the country of location.
If a company had applied the CRP estimated for the ‘high capital intensity’ project to the ‘low capital intensity’ project, it would have over-valued the latter investment significantly.
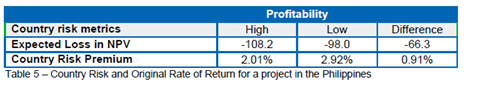
For the final factor, the original rate of return, the study compared two greenfield investment projects that were identical in terms of: country location, economic sector, exposure to country risk events, and project profile. However, in one case we assumed that the selling price of the goods or services produced was higher than in the other so that the original IRR was increased by 5%; NPV correspondingly rose to $293 million from $100 million.
The results in Table 5 show that the CRP is lower for the project with a higher original rate of return. Although its NPV is nearly three times greater, the NPV loss expected due to country risk rises much less proportionately. As a result, the discount rate needed to reproduce this loss – and thus the CRP to be added – is lower than for the less profitable investment.
The loss in NPV in the high profitability case caused by factors like higher costs is offset to a significant degree by the resulting lower tax payments. Applying the CRP for the project with high profitability to that with low profitability would have under-estimated the impact of country risk in the latter case; risk for the more profitable project would have been over-estimated if the CRP for the less profitable project had been used. The differences shown in Table 5 refer to the Philippines, but the discrepancy would have been even greater if the analysis had been applied to countries with higher risk premiums.
Risk mitigation
Using specific risk events to drive our modelling of NPV/IRR impact has the important added benefit of identifying the drivers of risk for a particular country and project. For example, in an analysis of a power generation project in Turkey, 28% of the expected loss came from currency risk, 15% from corporate tax and 14% from contract frustration. This allows a company to focus mitigation efforts on these most critical risks from the outset.
There is significant value to be gained by considering the cash flow impact of country risk as it varies by not only country but also by sector and project specifics. To do this, country risk should be incorporated in the financial evaluation of a new investment or existing business by adjusting cash flows for likely event impact rather than by adding a prior value for a CRP to the discount rate.


No comments yet