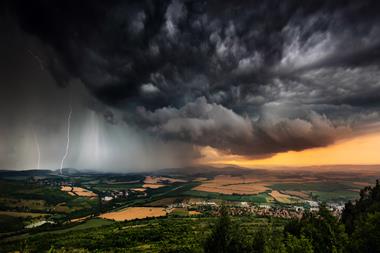
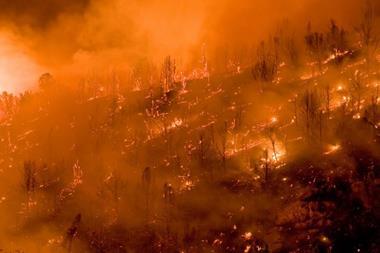
Charley, Frances, Ivan and Jeanne all paid a visit to Florida during a six week period in August and September 2004. The US National Hurricane Center said it was the first time on record that four hurricanes had hit the state in one year.
While Ivan was not a direct hit like the other three, the panhandle of Florida certainly felt the effects of the relatively stronger winds on the right side of the storm. Jeanne was unusual in that once it left the Caribbean on a northerly track, it made a 270deg loop and headed west to Florida. Charley made landfall as a category 4 storm (Saffir-Simpson Scale), Ivan and Jeanne were category 3, and Frances was a category 2.
Hurricane Andrew in 1992, a category 5 at landfall, cost insurers $15.5billion at contemporary values, according to Property Claim Services (PCS). Indexed to 2004, the insured loss was $20.3billion. The current estimated cost of the four 2004 hurricanes is $22.6billion.
The insurance industry responded well, and while there has been a significant earnings impact, capital bases are largely intact. The January 2005 reinsurance renewal period did not see dramatic price increases, although many Florida programmes will renew in June and July when the full extent of the losses to catastrophe programmes will be assessed.
Practically all reinsurers now use one or more probabilistic catastrophe models, whether off-the-shelf or developed in-house. Many brokers have also invested in the development of their own models for their clients, usually in territories where a commercial model may not be available.
Many insurers now also licence one or more of the vendor models.
Companies heavily rely on these models, not only to monitor risk accumulations subject to natural peril events, but also to calculate the expected losses and associated probabilities. Of course, models produce estimates of losses, not actual losses. The results are intended as a guide, rather than as absolute, accurate numbers. Employing a multi-model approach gives the user a range of opinions, which often is more useful in decision making than depending on one model alone.
All the hurricane activity in 2004 has provided plenty of actual data to evaluate the catastrophe models used by the insurance industry. The discussion that follows looks at how they performed and what we can learn for future catastrophe risk assessments.
Actual losses v model 'footprints'
Some of the cat model vendors have issued custom built wind field footprints for the four 2004 events. These contain the modelled peak gust wind speeds at ZIP code and county level within the affected area. The results from running the footprints can be compared to actual losses incurred to see how the model performs for a given Florida portfolio.
The reinsurer will be concerned when the footprint loss is much less than the actual loss. This, of course, implies that the model has underestimated the particular event's impact. While this might suit the insurer for programme pricing, it may find that it has not purchased enough catastrophe protection.
We at Tokio Millennium Re estimate that the vendor models have, not insignificantly, underestimated losses on an industry wide basis. This may be because the industry exposure database underestimates insured values or the damageability functions were inaccurate.
The catastrophe modelling firms are undertaking detailed research into the characteristics and effects of each storm and will no doubt comment on their findings very soon. They will probably make some revisions in their assumptions. How dramatic these changes will be remains to be seen, but it is likely that any updates will be relatively minor for loss severity.
We might see some changes for loss frequency.
Exposure data
Garbage in - garbage out! It's a cliche, but it is quite applicable to catastrophe modelling. The models are not perfect, and it is possible to have good data producing unreliable results, but this is a separate issue.
As reinsurers, we rely on the data furnished to us by, in most cases, the reinsurance broker. We usually receive this exposure data in the form of a standardised model input file which can be 'plugged' directly into the model. The broker will have received the data in a raw format and converted it for use in the models. Once the data is successfully imported, the model will then produce estimates of expected losses.
Accuracy of the data is crucial for receiving reliable results from the cat models. The following are important considerations:
Data completeness and 'cleanliness'
Often, data received has an element of 'unknown' classifications in terms of location, so reinsurers need to attach a location which may not reflect the actual exposure. 'Cleanliness' implies data that is readable by the software.
Data modifiers
These include occupancy, construction, year built, policy limits and deductibles.
Some models can incorporate details such as cladding, quality of construction, design codes, roof systems, roof age, wind resistant windows etc.
Often, however, this detail is not available, and the broker or cedant makes assumptions or estimates. Accurate reporting of these modifiers can have varying degrees of effect in terms of damageability.
Insurance-to-value
Underinsurance can be a major factor in underestimating the loss potential.
It can be difficult to know whether an insurer is accurately appraising the value of insured properties and reporting it to reinsurers. This has certainly been a factor in the 2004 hurricanes.
Analysis
Before running the analysis, there are a few variables to consider:
Exposure growth
Typically, the data provided will be three to 12 months old by the time the reinsurer receives it. Therefore, the analyst needs to adjust the values to those expected during the period that the policy is in force.
This assumption will be made using information from the submission or from the broker. If it is not available, the projected premium growth will be used as the guide.
Demand surge
Vendor models provide the ability to either turn on or turn off demand surge, the inflationary effect of a sudden, widespread increase in demand for building materials and services. The effect of demand surge is still being calculated for the 2004 hurricanes and was clearly different for Charley compared to Jeanne, as resources were being stretched. Modelling companies will, no doubt, re-visit their demand surge loading factors now that they have been thoroughly tested.
River flood, storm surge, fire following earthquake and earthquake sprinkler leakage
The analyst again has the option to include or exclude these additional elements.
After the analysis has been run in each of the available models, there are other factors to consider:
Unmodelled perils
Catastrophe models can now model for hurricane, earthquake and tornado/hail.
The reinsurance contract may cover other perils, such as winter/ice storm, flood, brush fire and fire conflagration. Other, more remote perils could cause significant claims, for example, meteor/asteroid impact, tsunami/sea quake and landslide.
Model spread
It is well known that the different models produce different results.
Organisations that have more than one model must decide which output or combination of outputs to use for their expected losses. The reinsurer also often receives the broker's or reinsured's results, and they are not always the same as the reinsurer's numbers. Usually, this is because the broker or reinsured has not included demand surge, fire following earthquake or, perhaps, storm surge accompanying wind damage in the analysis.
Historical loss analysis
It is possible to run historical losses such as Hurricane Andrew or the 1994 Northridge, California earthquake through the portfolio. This loss output can be compared directly with the reinsured's actual experience from the same event, after adjusting for exposure changes from when the loss occurred to the present day. This can be a good way of calibrating the reliability of the model.
Conclusions
We have attempted to understand the differences in the actual versus modelled hurricane event losses. We have found that the most significant factors for the miscalculation of the modelled losses are occupancy and construction coding.
Demand surge, commercial business interruption insurance and underinsurance, which is common across the industry, are the other main drivers.
In 2004, with four events in six weeks, the supply of building materials and labour became considerably restricted. Hence, the extended time commercial entities needed to obtain the required goods and services caused an increase in the number or size of business interruption claims. This also impacted claims as a result of additional living expenses for homeowners.
Increased frequency of hurricane events is predicted at least in the short term as a result of climate change and global warming. The industry has already begun to prepare for multiple storms, but 2004 was unusual because one state experienced four major hurricanes in one summer.
As data quality and quantity improve and the modelling firms continue to refine their models, the model results should more closely resemble reality. Models however, are just models and can not precisely predict the future but serve as a reasonable guide for the industry.
- Simon Arnott is vice president, Tokio Millennium Re, Bermuda.
Email: SArnott@tokiomillennium.com
Web: www.tokiomillennium.com


